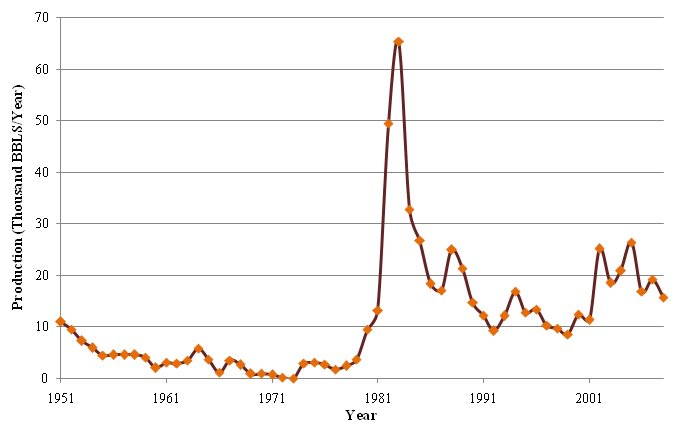
| Year | Production |
| 2009 | 11.4 |
| 2008 | 15.7 |
| 2007 | 19.2 |
| 2006 | 16.9 |
| 2005 | 26.4 |
| 2004 | 20.8 |
| 2003 | 18.5 |
| 2002 | 25.1 |
| 2001 | 11.3 |
| 2000 | 12.4 |
| 1999 | 8.5 |
| 1998 | 9.6 |
| 1997 | 10.3 |
| 1996 | 13.4 |
| 1995 | 12.7 |
| 1994 | 16.8 |
| 1993 | 12.1 |
| 1992 | 9.2 |
| 1991 | 12.2 |
| 1990 | 14.7 |
| 1989 | 21.3 |
| 1988 | 24.9 |
| 1987 | 17.1 |
| 1986 | 18.3 |
| 1985 | 26.7 |
| 1984 | 32.8 |
| 1983 | 65.4 |
| 1982 | 49.4 |
| 1981 | 13.2 |
| 1980 | 9.5 |
| 1979 | 3.7 |
| 1978 | 2.4 |
| 1977 | 1.7 |
| 1976 | 2.7 |
| 1975 | 3 |
| 1974 | 2.8 |
| 1973 | 0 |
| 1972 | 0.1 |
| 1971 | 0.6 |
| 1970 | 0.9 |
| 1969 | 0.8 |
| 1968 | 2.6 |
| 1967 | 3.5 |
| 1966 | 1.1 |
| 1965 | 3.6 |
| 1964 | 5.8 |
| 1963 | 3.5 |
| 1962 | 2.8 |
| 1961 | 3 |
| 1960 | 2 |
| 1959 | 4 |
| 1958 | 4.5 |
| 1957 | 4.5 |
| 1956 | 4.5 |
| 1955 | 4.4 |
| 1954 | 5.9 |
| 1953 | 7.2 |
| 1952 | 9.4 |
| 1951 | 10.9 |
Source:
1960 to 1989 production data has been taken from the 1991 paper publication of Virginia Energy Patterns and Trends, VCCER. The data had been originally published in Virginia and Oil Reports, VDMME, Division of Gas and Oil.
Virginia Gas and Oil Reports, DMME, Division of Gas and Oil.
| County and Company | 2009 | 2008 | 2007 | 2006 | 2005 | 2004 | 2003 | 2002 | 2001 | 2000 | 1999 | 1998 | 1997 | 1996 | 1995 | 1994 | 1993 | 1992 | 1991 | 1990 |
| Total | 11,430 | 15,712 | 19,155 | 16,881 | 26,417 | 20,816 | 18,489 | 25,110 | 11,344 | 12,418 | 8,804 | 9,646.11 | 10,337.07 | 13,363.30 | 12,654.58 | 16,766.77 | 12,120.14 | 12,881 | 12,161.34 | 14,676.90 |
| County: Buchanan | - | - | 95 | 538 | 689 | 1,395 | - | - | - | - | - | - | - | - | - | - | - | - | - | - |
| Chesapeake Appalachia, LLC | - | - | 95 | 538 | - | - | - | - | - | - | - | - | - | - | - | - | - | - | - | - |
| Columbia Natural Resources | - | - | - | 689 | 1,395 | - | - | - | - | - | - | - | - | - | - | - | - | - | - | |
| County: Lee | 9,206 | 11,699 | 12,641 | 10,382 | 20,709 | 12,706 | 12,699 | 19,034 | 6,903 | 5,799 | 2,460 | 3,888.61 | 5,081.16 | 6,436.94 | 6,503.01 | 6,646.71 | 6,319.90 | 9,213.87 | 10,417.63 | 12,017.51 |
| A.E.H. Rentals, LLC | 165 | - | 827 | - | - | - | - | - | - | - | - | - | - | - | - | - | - | - | - | - |
| APACO | - | - | - | - | - | - | 32 | 429 | 402 | 362 | 240 | 265.59 | 426.69 | 408.33 | 448.18 | 497.15 | 477.19 | 600.21 | 622.50 | 665.73 |
| Amvest Oil and Gas Inc. | - | - | - | - | - | - | - | - | - | 60 | - | 10 | 152.50 | 188.13 | 55 | - | - | - | - | - |
| Ben Hur Oil and Gas Inc. | - | - | - | - | - | - | - | - | - | 111 | 227 | 805 | 1,028 | 1,228 | 1,131 | 1,406 | 1,228 | 1,556 | 1,537 | 2,103 |
| Daugherty Petroleum, Inc. | 9,041 | 11,372 | 10,708 | 9,458 | 19,200 | - | - | - | - | - | - | - | - | - | - | - | - | - | - | - |
| Eastern States Oil and Gas Inc. | - | - | - | - | - | - | - | - | - | - | - | 679 | 1,031 | 1,148.70 | 1,060.70 | 1,078.65 | 1,206 | 1,706 | 1,560 | 1,884 |
| Equitable Production Co. | - | 327 | 398 | 334 | 276 | 398 | 256 | - | - | - | - | - | - | - | - | - | - | - | - | - |
| Evan Energy Company, LC | - | - | - | - | - | 10,635 | 10,318 | 15,606 | 1,599 | 1,173 | 336 | 276 | 282 | - | - | - | - | - | - | - |
| Maverick Oil and Gas Co. | - | - | - | - | - | - | - | - | - | - | - | - | 66 | 1,102 | 986 | 1,914 | 1,531 | 2,000 | 3,127.55 | 4,586.62 |
| Petroleum Partners | - | - | - | - | - | - | - | - | - | - | - | - | - | - | - | - | - | 600 | 28 | 53 |
| Pride Oil Company | - | - | - | 327 | 669 | 1,178 | 1,218 | 1,287 | 735 | 1,310 | 1,657 | 1,284.72 | 1,458.37 | 1,454.78 | 1,472.66 | 1,477.91 | 1,648.01 | 1,856.47 | 1,674.58 | 1,631.16 |
| Stonewall Gas | - | - | - | - | - | - | - | - | - | - | - | - | - | - | - | - | - | 667.19 | 1,628 | 979 |
| United Well Services Inc. | - | - | 708 | 263 | 564 | 495 | 875 | 1,712 | 4,167 | 2,783 | - | 408.30 | 544.60 | 696 | 1,063.47 | - | - | - | - | - |
| Witt Oil Drilling | - | - | - | - | - | - | - | - | - | - | - | 160 | 92 | 211 | 286 | 273 | 229.70 | 228 | 240 | 115 |
| County: Russell | - | 151 | 663 | - | - | - | - | - | - | - | - | - | - | - | - | - | - | - | - | - |
| Equitable Resources Co. | - | 151 | 663 | - | - | - | - | - | - | - | - | - | - | - | - | - | - | - | - | - |
| County: Wise | 2,224 | 3,862 | 5,756 | 5,691 | 5,019 | 5,790 | 6,076 | 4,441 | 6,619 | 6,344 | 5,757.50 | 5,255.91 | 6,926.36 | 6,111.57 | 10,120.06 | 5,800.24 | 3,667.13 | 1,743.71 | 2,659.39 | - |
| Equitable Resources Co. | 2,224 | 3,862 | 5,756 | 5,691 | 5,019 | 5,790 | 6,076 | 4,441 | 6,619 | 6,344 | 5,757.50 | 5,255.91 | 6,926.36 | 6,111.57 | 10,120.06 | 5,800.24 | 3,667.13 | 1,743.71 | 2,659.39 | - |
Notes:
Source:
| Year | Production (Thousand Barrels) |
| 2010 | 6 |
| 2009 | 14 |
| 2008 | 7 |
| 2007 | 18 |
| 2006 | 7 |
| 2005 | 8 |
| 2004 | 19 |
| 2003 | 18 |
| 2002 | 22 |
| 2001 | 12 |
| 2000 | 7 |
| 1999 | 8 |
| 1998 | 6 |
| 1997 | 10 |
| 1996 | 13 |
| 1995 | 12 |
| 1994 | 7 |
| 1993 | 12 |
| 1992 | 9 |
| 1991 | 11 |
| 1990 | 15 |
Source:
| County and Company | 2009 | 2008 | 2007 | 2006 | 2005 | 2004 | 2003 | 2002 | 2001 | 2000 | 1999 | 1998 | 1997 | 1996 | 1995 | 1994 | 1993 | 1992 | 1991 | 1990 | |
| Total | 68 | - | 3 | 3 | 3 | 6 | 7 | 11 | 52 | 54 | 57 | 61 | 65 | 39 | 63 | 54 | 50 | 40 | 34 | 42 | |
| County: Buchanan | - | - | - | 1** | 1** | 1** | 1** | - | - | - | - | - | - | - | - | - | - | - | - | - | - |
| Chesapeake Appalachia, LLC | - | - | 1** | 1** | - | - | - | - | - | - | - | - | - | - | - | - | - | - | - | - | |
| Columbia Natural Resources | - | - | - | - | 1** | 1** | - | - | - | - | - | - | - | - | - | - | - | - | - | - | |
| County: Lee | 48 | 38 | 3 | 3 | 3 | 6 | 7 | 11 | 14 | 10 | 13 | 17 | 21 | 18 | 21 | 22 | 22 | 21 | 23 | 22 | |
| A.E.H. Rentals LLC | 1 | - | 1 | - | - | - | - | - | - | - | - | - | - | - | - | - | - | - | - | - | |
| APACO | - | - | - | - | - | - | 1 | 5 | 5 | 5 | 5 | 5 | 4 | 4 | 5 | 5 | 5 | 5 | 4 | 4 | |
| Amvest Oil and Gas Inc. | - | - | - | - | - | - | - | - | - | - | - | 1 | 1 | 1 | 1 | - | - | - | - | - | |
| Ben Hur Oil and Gas Inc. | - | - | - | - | - | - | - | - | - | - | 5 | 5 | 5 | 5 | 5 | 5 | 5 | 5 | 6 | 5 | |
| Daugherty Petroleum, Inc. | 46 | 35 | 1, 42 | 25** | 21** | - | - | - | - | - | - | - | - | - | - | - | - | - | - | - | |
| Eastern States Oil and Gas Inc. | - | - | - | - | - | - | - | - | - | - | - | 1 | 1 | 1 | 1 | 1 | 1 | 1 | 1 | 1 | |
| Equitable Resources Co. | 3 | 1 | 2** | 2** | 2** | 1** | - | - | - | - | - | - | - | - | - | - | - | - | - | ||
| Evan Energy Company, LC | - | - | - | - | - | 25**1 | 25**1 | 8** | 3 | 4 | 2 | 2 | 3 | - | - | - | - | - | - | - | |
| Maverick Oil and Gas Co. | - | - | - | - | - | - | - | - | - | - | - | 3 | 4 | 6 | 9 | 9 | 5 | 5 | 5 | ||
| Petroleum Partners | - | - | - | - | - | - | - | - | - | - | - | - | - | - | - | - | - | 1 | 1 | 1 | |
| Pride Oil Company | - | - | - | - | 1 | 1 | 1 | 1 | 1 | 1 | 1 | 1 | 1 | 1 | 1 | 1 | 1 | 1 | 1 | 1 | |
| Stonewall Gas | - | - | - | - | - | - | - | - | - | - | - | - | - | - | - | - | - | 2 | 4 | 4 | |
| United Well Services Inc. | - | - | 1 | 2 | 2 | 4 | 4 | 5 | 5 | - | - | 1 | 2 | 1 | 1 | - | - | - | - | - | |
| Witt Oil Drilling | - | - | - | - | - | - | - | - | - | - | - | 1 | 1 | 1 | 1 | 1 | 1 | 1 | 1 | 1 | |
| County: Russell | - | 1 | 1 | - | - | - | - | - | - | - | - | - | - | - | - | - | - | - | - | - | |
| Equitable Resources Co. | - | 1 | 1 | 1 | - | - | - | - | - | - | - | - | - | - | - | - | - | - | - | - | |
| County: Wise | 20 | 36 | 15 | 41** | 0 | 0 | 0 | 0 | 38 | 44 | 44 | 44 | 44 | 21 | 42 | 32 | 28 | 19 | 11 | 20 | |
| Equitable Resources Co. | 20 | 36 | 15 | 43 | 41** | 44** | 32** | 3** | 38 | 44 | 44 | 44 | 44 | 21 | 42 | 32 | 28 | 19 | 11 | 20 |
Notes:
Number and Process Capacity of Operable Petroleum Refineries
| 2011 | 2010 | 2009 | 2008 | 2007 | 2006 | 2005 | 2004 | 2003 | 2002 | 2001 | 2000 | 1999 | 1998 | 1997 | 1996 | 1995 | 1994 | 1993 | 1992 | 1991 | |
| Number of Operable Refineries | |||||||||||||||||||||
| Total | 1 | 1 | 1 | 1 | 1 | 1 | 1 | 1 | 1 | 1 | 1 | 1 | 1 | 1 | 1 | 1 | 1 | 1 | 1 | 2 | 2 |
| Operating | 0 | 1 | 1 | 1 | 1 | 0 | 1 | 1 | 1 | 1 | 1 | 1 | 1 | 1 | 1 | 1 | 1 | 1 | 1 | 2 | 2 |
| Idle | 1 | 0 | 0 | 0 | 0 | 1 | 0 | 0 | 0 | 0 | 0 | 0 | 0 | 0 | 0 | 0 | 0 | 0 | 0 | 0 | 0 |
| Crude Oil Distillation Capacity | |||||||||||||||||||||
| Total (Barrels per calendar day) | 66,300 | 66,300 | 64,500 | 63,650 | 59,375 | 58,600 | 58,600 | 58,600 | 58,600 | 58,600 | 58,600 | 59,700 | 59,500 | 58,600 | N/A | 56,700 | 53,000 | 53,000 | 53,000 | 59,100 | 56,700 |
| Operating | 0 | 66,300 | 64,500 | 63,650 | 59,375 | 0 | 58,600 | 58,600 | 58,600 | 58,600 | 58,600 | 59,700 | 59,500 | 58,600 | N/A | 56,700 | 53,000 | 53,000 | 53,000 | 59,100 | 56,700 |
| Idle | 66,300 | 0 | 0 | 0 | 0 | 58,600 | 0 | 0 | 0 | 0 | 0 | 0 | 0 | 0 | N/A | 0 | 0 | 0 | 0 | 0 | 0 |
| Total (Barrels per stream day) | 70,800 | 70,800 | 68,000 | 67,000 | 62,500 | 61,800 | 61,800 | 61,800 | 61,800 | 61,800 | 61,800 | 61,800 | 61,900 | 61,900 | N/A | 59,700 | 56,000 | 56,000 | 56,000 | 63,600 | 60,000 |
| Operating | 0 | 70,800 | 68,000 | 67,000 | 62,500 | 0 | 61,800 | 61,800 | 61,800 | 61,800 | 61,800 | 61,800 | 61,900 | 61,900 | N/A | 59,700 | 56,000 | 56,000 | 56,000 | 63,600 | 60,000 |
| Idle | 70,800 | 0 | 0 | 0 | 0 | 61,800 | 0 | 0 | 0 | 0 | 0 | 0 | 0 | 0 | N/A | 0 | 0 | 0 | 0 | 0 | 0 |
| Downstream Charge Capacity (Barrels per stream day) | |||||||||||||||||||||
| Vacuum Distillation | 44,500 | 44,500 | 41,500 | 40,000 | 37,300 | 37,300 | 37,300 | 37,300 | 37,300 | 37,300 | 37,300 | 37,300 | 34,700 | 34,700 | N/A | 34,000 | 29,000 | 29,000 | 29,000 | 29,000 | 29,000 |
| Thermal Cracking (delayed coking only) | 22,000 | 22,000 | 22,500 | 20,000 | 19,000 | 19,000 | 19,000 | 19,000 | 19,000 | 19,000 | 19,000 | 19,000 | 20,500 | 20,500 | N/A | 19,000 | 14,000 | 14,000 | 14,000 | 14,000 | 14,000 |
| Catalytic Cracking | 30,900 | 30,900 | 30,200 | 30,200 | 30,200 | 30,200 | 30,200 | 30,200 | 30,200 | 30,200 | 30,200 | 30,200 | 30,100 | 30,100 | N/A | 29,000 | 29,500 | 29,500 | 29,500 | 29,500 | 29,500 |
| - Fresh | 28,200 | 28,200 | 28,200 | 28,200 | 28,200 | 28,200 | 28,200 | 28,200 | 28,200 | 28,200 | 28,200 | 28,200 | 28,100 | 28,100 | N/A | 27,000 | 27,500 | 27,500 | 27,500 | 27,500 | 27,500 |
| - Recycled | 2,700 | 2,700 | 2,000 | 2,000 | 2,000 | 2,000 | 2,000 | 2,000 | 2,000 | 2,000 | 2,000 | 2,000 | 2,000 | 2,000 | N/A | 2,000 | 2,000 | 2,000 | 2,000 | 2,000 | 2,000 |
| Catalytic Hydrocracking | 0 | 0 | 0 | 0 | 0 | 0 | 0 | 0 | 0 | 0 | 0 | 0 | 0 | 0 | N/A | 0 | 0 | 0 | 0 | 0 | 0 |
| Catalytic Reforming | 11,700 | 11,700 | 12,100 | 12,100 | 12,100 | 12,100 | 12,100 | 12,100 | 12,100 | 12,100 | 12,100 | 12,100 | 11,400 | 11,400 | N/A | 11,400 | 11,500 | 10,200 | 10,200 | 10,200 | 10,200 |
| Catalytic Hydrotreating | 73,500 | 73,500 | 72,960 | 72,860 | 42,860 | 30,860 | N/A | 30,860 | 30,860 | 30,860 | 30,860 | 30,860 | 30,800 | 30,800 | N/A | 30,400 | 27,800 | 26,500 | 26,500 | 26,500 | 26,500 |
| - Naptha Reformer Feed | 12,000 | 12,000 | 12,000 | 11,900 | 11,900 | 11,900 | N/A | 11,900 | 11,900 | 11,900 | 11,900 | 11,900 | 11,900 | 11,900 | N/A | 11,700 | 11,800 | 10,500 | N/A | N/A | N/A |
| - Distillate | 19,500 | 19,500 | 18,960 | 18,960 | 18,960 | 18,960 | N/A | 18,960 | 18,960 | 18,960 | 18,960 | 18,960 | 18,900 | 18,900 | N/A | 18,700 | 16,000 | 16,000 | N/A | N/A | N/A |
Notes:
| 2011 | 2010 | 2009 | 2008 | 2007 | 2006 | 2005 | 2004 | 2003 | 2002 | 2001 | 2000 | 1999 | 1998 | 1997 | 1996 | 1995 | 1994 | 1993 | 1992 | 1991 | |
| Alkylates | 5,200 | 5,200 | 4,200 | 4,200 | 4,200 | 4,200 | 4,200 | 4,200 | 4,200 | 4,200 | 4,200 | 4,200 | 4,200 | 4,200 | 3,500 | 3,500 | 0 | 0 | 0 | 0 | 0 |
| Marketable Petroleum Coke | 6,000 | 6,000 | 6,000 | 5,800 | 5,400 | 5,400 | 5,400 | 5,400 | 5,400 | 5,400 | 5,400 | 5,400 | 3,300 | 6,100 | 5,050 | 5,050 | 5,100 | 5,100 | 5,100 | 5,100 | 5,100 |
Notes:
Source:
| Year | Company Name | Product | Supply | Current Year: Barrels per Stream day |
Current Year: Barrels per Calendar Day |
Next Year: Barrels per Stream Day |
| 2007 | Giant Yorktown Refining | Alkylates | Production Capacity | *4,200 | - | *4,200 |
| Cat Cracking: Fresh Feed | Downstream Charge Capacity | 28,200 | 27,200 | 28,200 | ||
| Cat Cracking: Recycled Feed | Downstream Charge Capacity | 2,000 | - | 2,000 | ||
| Cat Reforming: High Pressure | Downstream Charge Capacity | 12,100 | - | 12,100 | ||
| Desulfurization, Naphtha/Reformer Feed | Downstream Charge Capacity | 11,900 | - | 11,900 | ||
| Desulfurization, Other Distillate | Downstream Charge Capacity | 18,960 | - | 18,960 | ||
| Hydrogen (MMCFD) | Production Capacity | 14 | - | - | ||
| Operating Capacity | Atmospheric Crude Distillation Capacity | 62,500 | 59,375 | - | ||
| Petcoke, Market | Production Capacity | 5,400 | - | - | ||
| Sulfur (Short Tons/Day) | Production Capacity | 60 | - | - | ||
| Therm Cracking, Delayed Coking | Downstream Charge Capacity | 19,000 | - | - | ||
| Total Operable Capacity | Atmospheric Crude Distillation Capacity | 62,500 | 59,375 | (projected) 62,500 | ||
| Vacuum Distillation | Downstream Charge Capacity | 37,300 | - | 37,300 | ||
| 2006 | Giant Yorktown Refining | Alkylates | Production Capacity | *4,200 | - | *4,200 |
| Cat Cracking: Fresh Feed | Downstream Charge Capacity | 28,200 | 27,200 | 28,200 | ||
| Cat Cracking: Recycled Feed | Downstream Charge Capacity | 2,000 | - | 2,000 | ||
| Cat Reforming: High Pressure | Downstream Charge Capacity | 12,100 | - | 12,100 | ||
| Desulfurization, Naphtha/Reformer Feed | Downstream Charge Capacity | 11,900 | - | 11,900 | ||
| Desulfurization, Other Distillate | Downstream Charge Capacity | 18,960 | - | 18,960 | ||
| Hydrogen (MMCFD) | Production Capacity | 0 | - | - | ||
| Operating Capacity | Atmospheric Crude Distillation Capacity | 61,800 | 58,600 | - | ||
| Petcoke, Market | Production Capacity | 5,400 | - | - | ||
| Sulfur (Short Tons/Day) | Production Capacity | 39 | - | - | ||
| Therm Cracking, Delayed Coking | Downstream Charge Capacity | 19,000 | 18,600 | - | ||
| Total Operable Capacity | Atmospheric Crude Distillation Capacity | 61,800 | 58,600 | (projected) 61,800 | ||
| Vacuum Distillation | Downstream Charge Capacity | 37,300 | - | 37,300 | ||
| 2005 | Giant Yorktown Refining | Alkylates | Production Capacity | *4,200 | - | *4,200 |
| Cat Cracking: Fresh Feed | Downstream Charge Capacity | 28,200 | 27,200 | 28,200 | ||
| Cat Cracking: Recycled Feed | Downstream Charge Capacity | 2,000 | - | 2,000 | ||
| Cat Reforming: High Pressure | Downstream Charge Capacity | 12,100 | - | 12,100 | ||
| Desulfurization, Naphtha/Reformer Feed | Downstream Charge Capacity | 11,900 | - | 11,900 | ||
| Desulfurization, Other Distillate | Downstream Charge Capacity | 18,960 | - | 18,960 | ||
| Hydrogen (MMCFD) | Production Capacity | - | - | *14 | ||
| Operating Capacity | Atmospheric Crude Distillation Capacity | 61,800 | 58,600 | - | ||
| Petcoke, Market | Production Capacity | *5,400 | - | *5,400 | ||
| Sulfur (Short Tons/Day) | Production Capacity | *39 | - | *54 | ||
| Therm Cracking, Delayed Coking | Downstream Charge Capacity | 19,000 | 18,600 | 19,000 | ||
| Total Operable Capacity | Atmospheric Crude Distillation Capacity | 61,800 | 58,600 | (projected) 61,800 | ||
| Vacuum Distillation | Downstream Charge Capacity | 37,300 | - | 37,300 | ||
| 2004 | Giant Yorktown Refg | Sulfur (Short Tons/Day) | Production Capacity | *39 | - | *39 |
| Cat Cracking: Recycled Feed | Downstream Charge Capacity | 2,000 | - | 2,000 | ||
| Alkylates | Production Capacity | *4,200 | - | *4,200 | ||
| Petcoke, Market | Production Capacity | *5,400 | - | *5,400 | ||
| Desulfurization, Naphtha/Reformer Feed | Downstream Charge Capacity | 11,900 | - | 11,900 | ||
| Cat Reforming: High Pressure | Downstream Charge Capacity | 12,100 | - | 12,100 | ||
| Therm Cracking, Delayed Coking | Downstream Charge Capacity | 19,000 | 18,600 | 19,000 | ||
| Desulfurization, Other Distillate | Downstream Charge Capacity | 18,960 | - | 18,960 | ||
| Cat Cracking: Fresh Feed | Downstream Charge Capacity | 28,200 | 27,800 | 28,200 | ||
| Vacuum Distillation | Downstream Charge Capacity | 37,300 | - | 37,300 | ||
| Operating Capacity | Atmospheric Crude Distillation Capacity | - | 58,600 | - | ||
| Total Operable Capacity | Atmospheric Crude Distillation Capacity | 61,800 | 58,600 | (projected) 61,800 | ||
| 2003 | Giant Yorktown Refg | Alkylates | Production Capacity | *4,200 | - | *4,200 |
| Cat Cracking: Fresh Feed | Downstream Charge Capacity | 28,200 | 27,800 | 28,200 | ||
| Cat Cracking: Recycled Feed | Downstream Charge Capacity | 2,000 | - | 2,000 | ||
| Cat Hydrotreating, Distillate | Downstream Charge Capacity | 18,960 | - | 18,960 | ||
| Cat Hydrotreating, Naphthas/Reformer Feed | Downstream Charge Capacity | 11,900 | - | 11,900 | ||
| Cat Reforming: High Pressure | Downstream Charge Capacity | 12,100 | - | 12,100 | ||
| Operating Capacity | Atmospheric Crude Distillation Capacity | 61,800 | 58,600 | - | ||
| Petcoke, Market | Production Capacity | *5,400 | - | *5,400 | ||
| Sulfur (Short Tons/Day) | Production Capacity | *39 | - | *39 | ||
| Therm Cracking, Delayed Coking | Downstream Charge Capacity | 19,000 | 18,600 | 19,000 | ||
| Total Operable Capacity | Atmospheric Crude Distillation Capacity | 61,800 | 58,600 | (projected) 61,800 | ||
| Vacuum Distillation | Downstream Charge Capacity | 37,300 | - | 37,300 | ||
| 2002 | BP Products North America, Inc. | Alkylates | Production Capacity | *4,200 | - | *4,200 |
| Cat Cracking: Fresh Feed | Downstream Charge Capacity | 28,200 | 28,200 | 28,200 | ||
| Cat Cracking: Recycled Feed | Downstream Charge Capacity | 2,000 | - | 2,000 | ||
| Cat Hydrotreating, Distillate | Downstream Charge Capacity | 18,960 | - | 18,960 | ||
| Cat Hydrotreating, Naphthas/Reformer Feed | Downstream Charge Capacity | 11,900 | - | 11,900 | ||
| Cat Reforming: High Pressure | Downstream Charge Capacity | 12,100 | - | 12,100 | ||
| Operating Capacity | Atmospheric Crude Distillation Capacity | 61,800 | 58,600 | - | ||
| Petcoke, Market | Production Capacity | *5,400 | - | *5,400 | ||
| Sulfur (Short Tons/Day) | Production Capacity | *39 | - | *39 | ||
| Therm Cracking, Delayed Coking | Downstream Charge Capacity | 19,000 | 18,600 | 19,000 | ||
| Total Operable Capacity | Atmospheric Crude Distillation Capacity | 61,800 | 58,600 | (projected) 61,800 | ||
| Vacuum Distillation | Downstream Charge Capacity | 37,300 | - | 37,300 | ||
| 2001 | BP Amoco PLC | Alkylates | Production Capacity | *4,200 | - | *4,200 |
| Cat Cracking: Fresh Feed | Downstream Charge Capacity | 28,200 | 27,400 | 28,200 | ||
| Cat Cracking: Recycled Feed | Downstream Charge Capacity | 2,000 | - | 2,000 | ||
| Cat Hydrotreating, Distillate | Downstream Charge Capacity | 18,960 | - | 18,960 | ||
| Cat Hydrotreating, Naphthas/Reformer Feed | Downstream Charge Capacity | 11,900 | - | 11,900 | ||
| Cat Reforming: High Pressure | Downstream Charge Capacity | 12,100 | - | 12,100 | ||
| Operating Capacity | Atmospheric Crude Distillation Capacity | 61,800 | 59,700 | - | ||
| Petcoke, Market | Production Capacity | *5,400 | - | *5,400 | ||
| Sulfur (Short Tons/Day) | Production Capacity | *39 | - | *39 | ||
| Therm Cracking, Delayed Coking | Downstream Charge Capacity | 19,000 | 17,100 | 19,000 | ||
| Total Operable Capacity | Atmospheric Crude Distillation Capacity | 61,800 | 59,700 | 61,800 | ||
| Vacuum Distillation | Downstream Charge Capacity | 37,300 | - | 37,300 | ||
| 2000 | BP Amoco PLC | Alkylates | Production Capacity | *4,200 | - | *4,200 |
| Cat Cracking: Fresh Feed | Downstream Charge Capacity | 28,100 | 27,500 | 28,100 | ||
| Cat Cracking: Recycled Feed | Downstream Charge Capacity | 2,000 | - | 2,000 | ||
| Cat Hydrotreating, Distillate | Downstream Charge Capacity | 18,900 | - | 18,900 | ||
| Cat Hydrotreating, Naphthas/Reformer Feed | Downstream Charge Capacity | 11,900 | - | 11,900 | ||
| Cat Reforming: High Pressure | Downstream Charge Capacity | 11,500 | - | 11,500 | ||
| Operating Capacity | Atmospheric Crude Distillation Capacity | 61,900 | 59,500 | - | ||
| Petcoke, Market | Production Capacity | *3,300 | - | *3,300 | ||
| Sulfur (Short Tons/Day) | Production Capacity | *39 | - | *39 | ||
| Therm Cracking, Delayed Coking | Downstream Charge Capacity | 20,500 | 18,000 | 20,500 | ||
| Total Operable Capacity | Atmospheric Crude Distillation Capacity | 61,900 | 59,500 | (projected) 61,900 | ||
| Vacuum Distillation | Downstream Charge Capacity | 34,700 | - | 34,700 | ||
| 1999 | BP Amoco PLC | Alkylates | Production Capacity | *4,200 | - | *4,200 |
| Cat Cracking: Fresh Feed | Downstream Charge Capacity | 28,100 | 26,700 | 28,100 | ||
| Cat Cracking: Recycled Feed | Downstream Charge Capacity | 2,000 | - | 2,000 | ||
| Cat Hydrotreating, Distillate | Downstream Charge Capacity | 18,900 | - | 18,900 | ||
| Cat Hydrotreating, Naphthas/Reformer Feed | Downstream Charge Capacity | 11,900 | - | 11,900 | ||
| Cat Reforming: Low Pressure | Downstream Charge Capacity | 11,400 | - | 11,400 | ||
| Operating Capacity | Atmospheric Crude Distillation Capacity | 61,900 | 58,600 | - | ||
| Petcoke, Market | Production Capacity | *6,100 | - | *6,100 | ||
| Sulfur (Short Tons/Day) | Production Capacity | *73 | - | *73 | ||
| Therm Cracking, Delayed Coking | Downstream Charge Capacity | 20,500 | 19,400 | 20,500 | ||
| Total Operable Capacity | Atmospheric Crude Distillation Capacity | 61,900 | 58,600 | (projected) 61,900 | ||
| Vacuum Distillation | Downstream Charge Capacity | 34,700 | - | 34,700 | ||
| 1997 | Amoco Oil Co. | Alkylates | Production Capacity | *3,500 | - | *3,500 |
| Cat Cracking: Fresh Feed | Downstream Charge Capacity | 27,000 | 25,700 | 27,000 | ||
| Cat Cracking: Recycled Feed | Downstream Charge Capacity | 2,000 | - | 2,000 | ||
| Cat Hydrotreating, Distillate | Downstream Charge Capacity | 18,700 | - | 18,700 | ||
| Cat Hydrotreating, Naphthas/Reformer Feed | Downstream Charge Capacity | 11,700 | - | 11,700 | ||
| Cat Reforming: Low Pressure | Downstream Charge Capacity | 11,400 | - | 11,400 | ||
| Operating Capacity | Atmospheric Crude Distillation Capacity | 59,700 | 56,700 | - | ||
| Petcoke, Market | Production Capacity | *5,050 | - | *5,050 | ||
| Sulfur (Short Tons/Day) | Production Capacity | *73 | - | *73 | ||
| Therm Cracking, Delayed Coking | Downstream Charge Capacity | 19,000 | 18,000 | 19,000 | ||
| Total Operable Capacity | Atmospheric Crude Distillation Capacity | 59,700 | 56,700 | (projected) 59,700 | ||
| Vacuum Distillation | Downstream Charge Capacity | 3,400 | - | 3,400 | ||
| 1995 | Amoco Oil Co. | Cat Cracking: Fresh Feed | Downstream Charge Capacity | 27,500 | 26,125 | 27,500 |
| Cat Cracking: Recycled Feed | Downstream Charge Capacity | 2,000 | - | 2,000 | ||
| Cat Hydrotreating, Distillate | Downstream Charge Capacity | 16,000 | - | 16,000 | ||
| Cat Hydrotreating, Naphthas/Reformer Feed | Downstream Charge Capacity | 11,800 | - | 11,800 | ||
| Cat Reforming: Low Pressure | Downstream Charge Capacity | 11,500 | - | 11,500 | ||
| Operating Capacity | Atmospheric Crude Distillation Capacity | 56,000 | 53,000 | - | ||
| Petcoke, Market | Production Capacity | *5,100 | - | *5,100 | ||
| Sulfur (Short Tons/Day) | Production Capacity | *73 | - | *73 | ||
| Therm Cracking, Delayed Coking | Downstream Charge Capacity | 14,000 | 13,300 | 14,000 | ||
| Total Operable Capacity | Atmospheric Crude Distillation Capacity | 56,000 | 53,000 | (projected) 56,000 | ||
| Vacuum Distillation | Downstream Charge Capacity | 29,000 | - | 29,000 | ||
| 1994 | Amoco Oil Co. | Cat Cracking: Fresh Feed | Downstream Charge Capacity | 27,500 | 26,125 | 27,500 |
| Cat Cracking: Recycled Feed | Downstream Charge Capacity | 2,000 | - | 2,000 | ||
| Cat Hydrotreating, Distillate | Downstream Charge Capacity | 16,000 | - | 16,000 | ||
| Cat Hydrotreating, Naphthas/Reformer Feed | Downstream Charge Capacity | 10,500 | - | 10,500 | ||
| Cat Reforming: Low Pressure | Downstream Charge Capacity | 10,200 | - | 10,200 | ||
| Operating Capacity | Atmospheric Crude Distillation Capacity | 56,000 | 53,000 | - | ||
| Petcoke, Market | Production Capacity | *5,100 | - | *5,100 | ||
| Sulfur (Short Tons/Day) | Production Capacity | *73 | - | *73 | ||
| Therm Cracking, Delayed Coking | Downstream Charge Capacity | 14,000 | 13,300 | 14,000 | ||
| Total Operable Capacity | Atmospheric Crude Distillation Capacity | 56,000 | 53,000 | (projected) 56,000 | ||
| Vacuum Distillation | Downstream Charge Capacity | 29,000 | - | 29,000 |
Note:
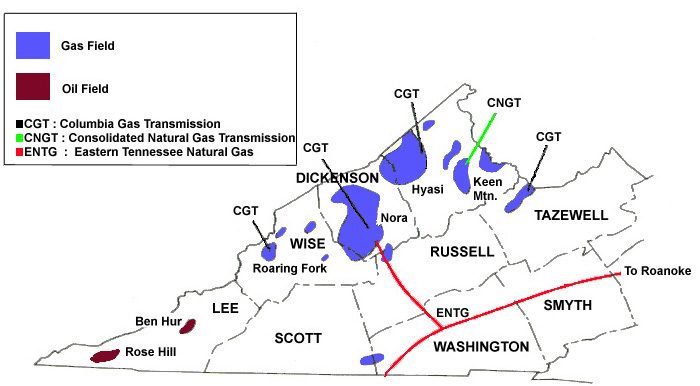
| Oil, Nonassociated Gas, and Associated-Dissolved Gas are Present | |||
| County | Field Name | Field Code | Discovery Year |
| Lee | Ben Hur | 055370 | 1963 |
| Lee | Rose Hill | 613301 | 1942 |
| Oil and Nonassociated Gas Present; Associated-Dissolved Gas Absent | |||
| County | Field Name | Field Code | Discovery Year |
| Lee | Knox | 384106 | 1982 |
| Nonassociated Gas Present; Oil and Associated-Dissolved Gas Absent | |||
| County | Field Name | Field Code | Discovery Year |
| Buchanan | Grundy East | 293208 | 1948 |
| Buchanan | Keen Mountain | 001394 | 1948 |
| Buchanan | Nora | 511254 | 1949 |
| Buchanan | Breaks-Haysi | 012915 | 1950 |
| Buchanan | Glick | 277145 | 1950 |
| Buchanan | Haysi | 311583 | 1950 |
| Buchanan | Virginia Field Area | 739968 | 1950 |
| Buchanan | Gluck | 008401 | 1955 |
| Buchanan | Hurley | 008403 | 1955 |
| Buchanan | Oakwood | 518178 | 1990 |
| Buchanan | Pilgrims Knob | 014798 | 1990 |
| Buchanan | Middle Ridge | 016863 | 2000 |
| Dickenson | Nora | 511254 | 1949 |
| Dickenson | Breaks-Haysi | 012915 | 1950 |
| Dickenson | Haysi | 311583 | 1950 |
| Lee | Roaring Fork | 008404 | 1953 |
| Rockingham | Bergton | 001991 | 1951 |
| Russell | Nora | 511254 | 1949 |
| Russell | Dante | 002047 | 1955 |
| Russell | Oakwood | 518178 | 1990 |
| Russell | Middle Ridge | 016863 | 2000 |
| Scott | Early Grove | 211424 | 1931 |
| Scott | High Knob | 008402 | 1975 |
| Scott | Northern Scott County | 001777 | 1976 |
| Smyth | Saltville | 015921 | 1996 |
| Tazewell | Berwind | 008387 | 1961 |
| Tazewell | Jewell Ridge | 358933 | 1961 |
| Tazewell | Virginia Field Area | 739968 | 1961 |
| Tazewell | Oakwood | 518178 | 1990 |
| Tazewell | Middle Ridge | 016863 | 2000 |
| Washington | Early Grove | 211424 | 1931 |
| Wise | Nora | 511254 | 1949 |
| Wise | Virginia Field Area | 739968 | 1949 |
| Wise | Coeburn | 002046 | 1953 |
| Wise | Roaring Fork | 008404 | 1953 |
| Wise | Stephens | 679615 | 1953 |
| Wise | Stonega | 682204 | 1953 |
| Wise | Bear Creek | 048643 | 1956 |
| Wise | High Knob | 008402 | 1975 |
| Wise | Black Creek | 068151 | 1983 |
| Wise | Flatwoods | 244544 | 1987 |
| Wise | Meade Creek | 463549 | 1987 |
| Wise | Wise | 774801 | 1988 |
Notes:
| All Grades | Regular | Midgrade | Premium | |||||||||
| Sales to End Users | Sales for Resale | Sales to End Users | Sales for Resale | Sales to End Users | Sales for Resale | Sales to End Users | Sales for Resale | |||||
| Through Retail Outlets | Other End Users | Through Retail Outlets | Other End Users | Through Retail Outlets | Other End Users | Through Retail Outlets | Other End Users | |||||
| 2008 | ||||||||||||
| January | 259.3 | W | 242 | 254.4 | W | 239.4 | 266.9 | - | 248.1 | 277.9 | W | 258.3 |
| February | 259 | W | 248.4 | 254.3 | W | 246 | 266 | W | 253.5 | 277.3 | W | 265.5 |
| March | 282.4 | W | 270 | 277.7 | W | 267.1 | 290.3 | W | 277 | 301.5 | W | 290.6 |
| April | 301.7 | W | 290.9 | 297 | W | 288.2 | 310.2 | W | 298.2 | 320.9 | W | 310.6 |
| May | 335.8 | W | 322 | 331.1 | W | 319.4 | 345.4 | W | 329.4 | 356.2 | W | 342.5 |
| June | 360.9 | W | 343.4 | 356 | W | 340.8 | 373.8 | W | 350.9 | 382.6 | W | 363.8 |
| July | 363.3 | W | 334.9 | 358.4 | W | 332.2 | 374.7 | W | 343.3 | 386 | W | 356.4 |
| August | 332.1 | W | 304.1 | 326.7 | W | 301.4 | 343.6 | W | 312.1 | 355.7 | W | 325.1 |
| September | 324 | W | 305.5 | 319.1 | W | 303 | 333.9 | W | 311.9 | 344.5 | W | 326.5 |
| October | 269.1 | N/A | 207.3 | 263.6 | N/A | 204.1 | 279.2 | W | 219.2 | 290.5 | W | 231.5 |
| November | 171.5 | W | 140.3 | 165.1 | W | 137.3 | 183.5 | W | 148.6 | 195.4 | W | 163 |
| December | 127.2 | 107.2 | 108.1 | 121.2 | 105.7 | 105.2 | 137.7 | W | 114.6 | 149.4 | 120.2 | 129 |
| Average | 283.9 | W | 259.6 | 279.7 | W | 257.1 | 293.2 | W | 268.5 | 300 | W | 277.1 |
| 2007 | ||||||||||||
| January | 181.9 | W | 156.8 | 176.7 | W | 153.9 | 189.6 | - | 164.2 | 201.2 | W | 173 |
| February | 181 | W | 169.1 | 176.1 | W | 166.8 | 188.2 | W | 173.5 | 199.5 | W | 183.2 |
| March | 210.6 | W | 197.7 | 205.9 | W | 195 | 218 | W | 203.9 | 229.3 | W | 214.6 |
| April | 243.7 | W | 227.7 | 238.9 | W | 224.5 | 252 | W | 234.8 | 263.2 | W | 248.2 |
| May | 263 | W | 245.8 | 258.2 | W | 242.9 | 270.6 | W | 252.8 | 282.1 | W | 264.8 |
| June | 259.3 | W | 235.5 | 254.2 | W | 232.1 | 267.6 | W | 243.5 | 279.1 | W | 257.6 |
| July | 250.1 | W | 230.1 | 245 | W | 226.7 | 257.7 | W | 237.3 | 269.9 | W | 251.9 |
| August | 231.1 | W | 212.3 | 225.9 | W | 208.9 | 238.8 | W | 219.3 | 250.2 | W | 234.1 |
| September | 229.1 | W | 218.4 | 224.1 | W | 215.4 | 236.4 | W | 223.1 | 247.4 | W | 237.2 |
| October | 231.5 | W | 219.9 | 226.5 | W | 217.1 | 238.9 | W | 224.8 | 249.7 | W | 238.3 |
| November | 261.7 | W | 246.6 | 256.9 | W | 244 | 269.4 | W | 252.7 | 280.4 | W | 265.1 |
| December | 257.3 | W | 237.1 | 252.3 | W | 243.3 | 264.9 | W | 243.2 | 276.3 | W | 254.8 |
| Average | 233.8 | W | 217.1 | 229 | W | 214.3 | 240.9 | W | 222.5 | 252.6 | W | 235.2 |
| 2006 | ||||||||||||
| January | 192.0 | W | 179.0 | 188.3 | W | 177 | 197.1 | W | 183.5 | 203.8 | W | 191.3 |
| February | 187.0 | 166.1 | 165.2 | 183.3 | 164.4 | 163.0 | 188.8 | W | 171.1 | 202.6 | W | 177.6 |
| March | 199.0 | W | 189.2 | 195.2 | 185.7 | 187.2 | 204.6 | W | 193.1 | 211.2 | W | 201.2 |
| April | 248.0 | W | 227.8 | 244.0 | 220.8 | 225.7 | 253.1 | W | 233.3 | 262.7 | W | 241.6 |
| May | 262.0 | W | 230.8 | 257.0 | 233.8 | 227.9 | 272.0 | W | 239.5 | 279.2 | W | 247.1 |
| June | 257.8 | 241.9 | 234.2 | 253.2 | 237.7 | 231.3 | 264 | W | 242.6 | 275.8 | W | 251.7 |
| July | 262.8 | W | 243.8 | 258.4 | W | 241.1 | 269.1 | W | 251.1 | 279.7 | W | 260.2 |
| August | 258.8 | W | 224.9 | 253.6 | W | 221.8 | 267.1 | W | 234.1 | 279.3 | W | 242.7 |
| September | 210.8 | W | 177.3 | 205.0 | W | 174.2 | 220 | W | 186.8 | 231.8 | W | 194.6 |
| October | 177.7 | 166.2 | 161.1 | 172.5 | 163.4 | 158.6 | 185.3 | W | 166.9 | 197.4 | W | 176.0 |
| November | 177.6 | W | 164.5 | 172.5 | W | 162 | 184.7 | W | 170 | 196.4 | W | 179.5 |
| December | 188.4 | 166.4 | 172.9 | 183.3 | 166.1 | 170.2 | 195.8 | W | 178.6 | 207.0 | W | 188.3 |
| Average | 219.0 | W | 198.7 | 214.6 | W | 196.3 | 224.8 | W | 205.7 | 235.2 | W | 213.1 |
| 2005 | ||||||||||||
| January | 137.5 | 126.8 | 130.7 | 133.8 | 126 | 128.7 | 143.7 | 128 | 134 | 147.6 | 130.2 | 139.9 |
| February | 145 | 134.4 | 132.8 | 141 | 132.9 | 130.7 | 149.1 | 135.8 | 137 | 159.9 | 141.7 | 142.3 |
| March | 158.3 | 147.2 | 152.9 | 154.9 | 145.5 | 151.1 | 163.4 | 148.9 | 155.9 | 168.7 | 155.8 | 161.9 |
| April | 179 | 160.3 | 163.6 | 175.2 | 158.3 | 161.4 | 183.8 | 164 | 168.8 | 192.2 | 170.5 | 174.9 |
| May | 170.5 | 154.9 | 152.2 | 166.4 | 152.6 | 149.7 | 174.7 | 157.3 | 158.0 | 185.0 | W | 164.2 |
| June | 170.2 | 159.2 | 161.4 | 167.6 | 157 | 159.2 | 175.6 | 162.7 | 165.8 | 182.3 | W | 172.3 |
| July | 185.3 | 176.3 | 171.5 | 181.6 | 174.3 | 169.1 | 190.7 | 178.4 | 177.2 | 198.6 | W | 184.3 |
| August | 208.4 | 192.9 | 196.6 | 205.3 | 190.7 | 194.6 | 214 | 196.7 | 201.5 | 219.3 | W | 208.4 |
| September | 250.8 | 222.9 | 229.1 | 247.4 | 218.3 | 226.8 | 254.9 | 234.1 | 234 | 264.6 | W | 242.6 |
| October | 233.6 | - | 201.5 | 230.1 | - | 199.2 | 233.9 | W | 207.7 | 251.2 | W | 214.7 |
| November | 178.3 | W | 158.8 | 174.2 | W | 156.4 | 181.6 | W | 164.6 | 196.1 | W | 171.5 |
| December | 174.8 | W | 163.3 | 170.9 | W | 161.2 | 181.8 | W | 167.8 | 187.4 | W | 175.4 |
| Average | 183.1 | 170.2 | 168.2 | 180.1 | 168.6 | 166.4 | 186.0 | 171.7 | 171.5 | 195 | 178.5 | 178 |
| 2004 | ||||||||||||
| January | 117.5 | 101.4 | 105.9 | 113.4 | 99.8 | 103.5 | 123.2 | 103.3 | 110 | 130.7 | 109.5 | 115.4 |
| February | 122.4 | 107.7 | 111 | 118.4 | 106 | 108.6 | 127.8 | 110.6 | 115 | 135.9 | 114 | 120.4 |
| March | 129.6 | 112.6 | 117.4 | 125.4 | 110.4 | 115 | 137 | 116.1 | 121.5 | 143.2 | 122.2 | 127 |
| April | 131.7 | 118.8 | 121.8 | 127.7 | 117 | 119.5 | 138.3 | 121.4 | 126.5 | 146.1 | 127.4 | 131.9 |
| May | 149.6 | 135.7 | 141.7 | 145.9 | 133.4 | 139.2 | 157.1 | 139.9 | 146 | 164.4 | 145.5 | 152.8 |
| June | 155.4 | 131.9 | 130.5 | 151.8 | 129.8 | 127.9 | 160.1 | 135.3 | 137 | 170.5 | 141.7 | 142 |
| July | 146.5 | 131.2 | 132.6 | 142.7 | 129.6 | 130.3 | 150 | 132.5 | 137.4 | 160.1 | 139.3 | 142.7 |
| August | 144.2 | 131 | 129.6 | 140.4 | 129.5 | 127.2 | 147.8 | 132.2 | 134.7 | 156.8 | 139.2 | 141 |
| September | 142.2 | 130.7 | 131.3 | 138.1 | 129.4 | 129 | 147.8 | 131.5 | 135.2 | 154.1 | 138.6 | 141.3 |
| October | 155.6 | 142.4 | 143.8 | 151.7 | 140.6 | 141.7 | 160.3 | 144.8 | 148.1 | 168.2 | 151.4 | 153.9 |
| November | 151.4 | 134.1 | 135.2 | 147.6 | 133.3 | 133 | 154.2 | 132.7 | 140.2 | 164.5 | 140.2 | 144.9 |
| December | 136.9 | 124.2 | 117.3 | 133.1 | 124.2 | 114.9 | 138.9 | 121.2 | 122.9 | 149.5 | 127.6 | 127.1 |
| Average | 139.2 | 124.7 | 126.9 | 135.4 | 123.2 | 124.6 | 144 | 126.2 | 131.1 | 152.7 | 132.6 | 136.7 |
| 2003 | ||||||||||||
| January | 107.5 | 92.9 | 96.3 | 103.4 | 91.3 | 93.9 | 112.5 | 93.4 | 100.3 | 121.5 | 100.9 | 104 |
| February | 121.5 | 105.6 | 109.1 | 117.8 | 104.2 | 106.7 | 126.9 | 106.4 | 113.5 | 134.7 | 112.8 | 118 |
| March | 127.4 | 107.7 | 109.3 | 123.6 | 106 | 106.7 | 132.6 | 109.7 | 114.8 | 141.6 | 115.7 | 119.4 |
| April | 121.3 | 93.1 | 97.1 | 117.2 | 91.4 | 94.2 | 126.3 | 94.7 | 103.5 | 136.3 | 101.1 | 107.3 |
| May | 111.4 | 88.1 | 91.2 | 107.2 | 86.5 | 88.2 | 116.6 | 89.1 | 96.8 | 126.6 | 95.9 | 101.1 |
| June | 107.9 | 91.1 | 92.4 | 103.7 | 89.5 | 89.7 | 113.2 | 92.2 | 97.4 | 122.6 | W | 101.7 |
| July | 110.7 | 93.8 | 97.2 | 106.5 | 92.2 | 94.6 | 116.2 | 94.8 | 101.7 | 124.7 | W | 106.5 |
| August | 118.7 | 103 | 106.5 | 114.7 | 101.2 | 104 | 124.6 | 105.2 | 110.7 | 132.4 | W | 116.3 |
| September | 123.5 | 97.1 | 97.5 | 119.4 | 94.4 | 94.4 | 128.4 | 98.7 | 104.6 | 138.4 | W | 108 |
| October | 116 | 93.7 | 96.3 | 111.8 | 92.4 | 93.5 | 120.9 | 94.2 | 102 | 130.8 | W | 106.5 |
| November | 109.5 | 92.5 | 92.9 | 105.1 | 91 | 90.2 | 114.6 | 93.4 | 97.8 | 123.7 | W | 102.5 |
| December | 106.4 | 92.3 | 93.4 | 102.2 | 91.7 | 90.9 | 111.7 | 92.5 | 97.3 | 120.5 | 97.8 | 102 |
| Average | 115.1 | 96.3 | 98.1 | 111 | 94.7 | 95.5 | 120.3 | 97.5 | 103.3 | 129.2 | 104.2 | 107.4 |
| 2002 | ||||||||||||
| January | 68.9 | 61.8 | 60.5 | 64.9 | 61 | 57.9 | 73.5 | 61.2 | 63.4 | 81.2 | 66.8 | 68.8 |
| February | 68.9 | 60.1 | 60.8 | 64.7 | 59.1 | 58.3 | 73.5 | 59.8 | 63.3 | 81.3 | 65.9 | 69 |
| March | 83 | 70.8 | 76.4 | 79.1 | 69.5 | 73.9 | 87.6 | 71.7 | 79.2 | 95.4 | 76.6 | 85.2 |
| April | 102.8 | 86.6 | 89.8 | 98.9 | 85.2 | 87 | 107.8 | 87.9 | 94.2 | 116.6 | 92.4 | 99.4 |
| May | 103.4 | 84.8 | 88.5 | 99.3 | 83.2 | 85.6 | 108.4 | 87.4 | 93.1 | 117.6 | 91 | 97.7 |
| June | 100.9 | 83.3 | 86.1 | 96.7 | 81.7 | 83.1 | 106 | W | 90.6 | 115.5 | 90.9 | 95.7 |
| July | 100.2 | 84.2 | 87.2 | 95.9 | 82.3 | 84.3 | 105.6 | 85.5 | 91.4 | 115.4 | 91.7 | 96.7 |
| August | 100 | 84 | 86.9 | 95.6 | 81.9 | 83.9 | 105.2 | W | 91.1 | 115 | W | 96.6 |
| September | 99.8 | 83.8 | 88.2 | 95.4 | 81.8 | 85.3 | 105.3 | 85.3 | 92.1 | 114.9 | W | 97.7 |
| October | 105.6 | 91.2 | 93.4 | 101.4 | 89.3 | 90.7 | 110.7 | 93.1 | 97.4 | 119.7 | 99.4 | 102.1 |
| November | 104.4 | 82.5 | 85 | 100 | 80.6 | 81.9 | 109.4 | 84.3 | 90.3 | 119.2 | 90.4 | 94.9 |
| December | 102.4 | 82 | 87.8 | 98 | 80.3 | 85 | 107.8 | 81.6 | 92.3 | 116.8 | 90.1 | 96.3 |
| Average | 95.2 | 80.8 | 82.9 | 91.1 | 79.1 | 80.1 | 100.1 | 81.9 | 86.7 | 108.7 | 88.2 | 91.9 |
| 2001 | ||||||||||||
| January | 109.7 | - | 95.4 | 105.1 | - | 92.6 | 115.2 | - | 99.1 | 124.8 | 93 | 104 |
| February | 110.4 | 92.5 | 95.4 | 105.6 | 90.4 | 92.5 | 116.5 | 93.1 | 99.5 | 125.4 | 98.6 | 104.8 |
| March | 108.2 | 89.9 | 91.8 | 103 | 87.3 | 88.7 | 115.2 | 90.7 | 96.3 | 123.8 | 97.8 | 102 |
| April | 119.9 | 106.1 | 108.1 | 115.4 | 104.5 | 105.1 | 125.7 | 107.7 | 112.1 | 134.8 | 109.7 | 118.3 |
| May | 129.4 | 110.3 | 112.1 | 124.8 | 109 | 109.1 | 137 | 113 | 117.5 | 144.4 | 113.2 | 122.5 |
| June | 124.3 | 100.4 | 97.1 | 120 | 98.5 | 93.9 | 128.9 | 101.4 | 103.5 | 141.3 | 106.7 | 108 |
| July | 110.4 | 79.9 | 83.1 | 105.4 | 77.9 | 79.8 | 117.5 | 80.8 | 89 | 127.3 | 89.1 | 93.3 |
| August | 101.9 | 84.2 | 86.1 | 97.1 | 82.5 | 83.4 | 108.1 | 85.7 | 89.8 | 118.7 | 91.5 | 95.6 |
| September | 103.1 | 88.8 | 87.1 | 98.2 | 87.3 | 84.4 | 109.4 | 89 | 90.7 | 119.3 | 96.1 | 96.2 |
| October | 87.9 | 68.8 | 70.4 | 83.6 | 67.4 | 67.4 | 93.2 | 69.4 | 74.9 | 102.3 | 75.8 | 79.5 |
| November | 74.1 | 61.4 | 61.2 | 69.7 | 60.2 | 58.4 | 79.6 | 61.8 | 64.7 | 87.4 | 67.6 | 69.8 |
| December | 67.7 | 56.9 | 58 | 63.5 | 55.8 | 55.5 | 72.1 | 56.5 | 60.8 | 80.5 | 63.2 | 66 |
| Average | 103.7 | 85.8 | 87.2 | 99.3 | 83.4 | 84.5 | 109.9 | 88.3 | 91.8 | 117.8 | 93.7 | 95.8 |
| 2000 | ||||||||||||
| January | 93.2 | 76.1 | 79 | 88.7 | 74.4 | 76 | 97.9 | W | 82.1 | 104.6 | W | 87.3 |
| February | 97.6 | 84.7 | 88 | 93.6 | 82.9 | 85.3 | 102 | W | 90.6 | 108.5 | W | 96 |
| March | 113.7 | 98.8 | 99.3 | 109.7 | 97.7 | 96.6 | 119 | W | 103.4 | 126 | W | 108.4 |
| April | 114 | 90.2 | 90.4 | 109.5 | 87.9 | 87.1 | 120.2 | W | 96 | 127.3 | W | 100.2 |
| May | 113.6 | 97 | 99 | 109.2 | 95 | 96.1 | 119.7 | W | 102.4 | 126.3 | W | 108.4 |
| June | 119.4 | 107.6 | 106.4 | 115.4 | 105.7 | 103.8 | 125.2 | W | 110.6 | 131.7 | W | 114.5 |
| July | 123.2 | 104.8 | 101.2 | 119.1 | 102.7 | 98.1 | 129.3 | W | 106.5 | 136.2 | W | 111.5 |
| August | 118.5 | 96.9 | 98.7 | 114.1 | 94.9 | 95.5 | 125.3 | W | 103.8 | 131.7 | W | 109.1 |
| September | 118.2 | 102.6 | 102.5 | 113.7 | 101.8 | 99.7 | 124.9 | W | 106.5 | 132.1 | 102.1 | 111.9 |
| October | 116.6 | 96.6 | 99.7 | 112 | 96.4 | 96.7 | 123.4 | W | 103.8 | 130.9 | 94.3 | 109.4 |
| November | 114.6 | 98.1 | 99.2 | 109.9 | 97.3 | 96.3 | 121.1 | W | 103.3 | 129.5 | W | 108.4 |
| December | 110.5 | 89.8 | 88.2 | 105.3 | 89.1 | 84.9 | 117.7 | 94.2 | 94 | 125.8 | 89.1 | 98.1 |
| Average | 113.2 | 96.2 | 96.3 | 109 | 94.9 | 93.5 | 118.9 | W | 100.3 | 125.9 | 99.7 | 105.3 |
| 1999 | ||||||||||||
| January | 57.3 | 39.8 | 43.7 | 51.6 | 37.9 | 40 | 62.5 | W | 46.3 | 68.1 | W | 51.9 |
| February | 55.5 | 38.5 | 41.8 | 49.7 | 36.2 | 38 | 60.5 | W | 44.5 | 66.4 | W | 49.8 |
| March | 59 | 44.2 | 49.9 | 53.5 | 42.3 | 46.5 | 63.5 | W | 51.9 | 70.3 | W | 57.5 |
| April | 70.4 | 55.8 | 59.4 | 65.3 | 53.6 | 55.8 | 74.7 | W | 61.9 | 82.4 | 62.7 | 67.9 |
| May | 73.6 | 57.6 | 59.4 | 68.6 | 55.1 | 56 | 78.2 | W | 62.6 | 85.1 | W | 67.7 |
| June | 73.4 | 56.7 | 59.5 | 68.1 | 54.5 | 56 | 78.4 | W | 62.3 | 85.4 | W | 68.1 |
| July | 75.8 | 62.2 | 65.8 | 70.9 | 60.3 | 62.5 | 80.5 | W | 68.2 | 87.1 | W | 73.8 |
| August | 81.8 | 67.9 | 70.8 | 77.3 | 66.2 | 67.5 | 86.6 | W | 73.5 | 92.8 | W | 79.3 |
| September | 85.8 | 71.5 | 75 | 81.1 | 69.7 | 71.8 | 90.9 | W | 77.7 | 97.5 | 76.6 | 83.3 |
| October | 83.8 | 70.7 | 72.6 | 78.8 | 69 | 69.2 | 89 | W | 76 | 96.6 | W | 81.4 |
| November | 84.7 | 71.1 | 75.7 | 79.7 | 69.4 | 72.7 | 89.7 | W | 78.6 | 97.3 | W | 83.4 |
| December | 91.9 | 75.1 | 76.7 | 87.3 | 73.4 | 73.6 | 96.7 | W | 80 | 103.2 | W | 85 |
| Average | 74.7 | 60.3 | 63.2 | 70 | 58.7 | 60.1 | 79.5 | W | 65.8 | 85.4 | W | 70.8 |
| 1998 | ||||||||||||
| January | 74.5 | 56.4 | 57.9 | 69.1 | 54.9 | 54.5 | 80.5 | W | 60.5 | 86.3 | W | 65.9 |
| February | 70.5 | 53.7 | 55.3 | 65 | 52.1 | 52 | 76.3 | W | 57.8 | 82.5 | W | 63.6 |
| March | 67.2 | 51.2 | 53.1 | 61.7 | 49.6 | 49.8 | 72.7 | W | 55.4 | 79.3 | W | 61 |
| April | 67.6 | 56.2 | 55.7 | 62.2 | 52.9 | 52.5 | 73.5 | W | 57.7 | 79.5 | W | 63.5 |
| May | 68.1 | 56.3 | 57.2 | 62.8 | 54.5 | 54 | 73.4 | W | 59.1 | 80.1 | 62.8 | 65.1 |
| June | 68.2 | 53.8 | 54.9 | 62.9 | 51.8 | 51.5 | 73.8 | W | 57.4 | 79.9 | W | 63.6 |
| July | 68 | 52.2 | 53.3 | 62.5 | 50.1 | 49.8 | 73.6 | W | 55.7 | 79.9 | W | 61.8 |
| August | 66.1 | 46.4 | 49.3 | 60.5 | 44.4 | 45.7 | 71.9 | W | 52.1 | 77.9 | W | 58.1 |
| September | 63.4 | 46.2 | 49.5 | 57.8 | 44.3 | 46.1 | 68.8 | W | 51.7 | 74.8 | W | 57.6 |
| October | 64.6 | 50.3 | 52.5 | 59.2 | 48.2 | 49 | 69.6 | W | 54.9 | 76.1 | W | 60.9 |
| November | 62.4 | 45.2 | 46.9 | 57 | 43.1 | 43.1 | 67.5 | W | 50 | 73.5 | W | 55.6 |
| December | 59.3 | 38 | 42 | 53.6 | 36 | 38.2 | 64.4 | W | 45.4 | 70 | W | 50.8 |
| Average | 66.5 | 50.7 | 52.2 | 61.1 | 48.8 | 48.8 | 72.1 | W | 54.8 | 78 | W | 60.5 |
| 1997 | ||||||||||||
| January | 89.5 | 74.4 | 76.7 | 84.5 | 72.9 | 73.5 | 95 | W | 78.9 | 102.1 | 80.9 | 84.3 |
| February | 88.9 | 71.7 | 73.5 | 83.9 | 70.1 | 70 | 94.8 | W | 76.1 | 101.2 | 78 | 82.2 |
| March | 86.3 | 67.8 | 71.2 | 81.2 | 66.1 | 67.9 | 92.1 | W | 73.7 | 98.4 | 73.7 | 80.1 |
| April | 83.7 | 66.6 | 69 | 78.6 | 64.9 | 65.7 | 89.4 | W | 71.4 | 95.7 | 72.8 | 77.6 |
| May | 82 | 66.4 | 69.6 | 76.7 | 65 | 66.5 | 87.8 | W | 71.7 | 94.5 | W | 77.3 |
| June | 81.7 | 65.1 | 66.6 | 76.5 | 63.3 | 63.4 | 87.5 | W | 69.2 | 94 | 71.8 | 74.3 |
| July | 80.7 | 64.7 | 67.4 | 75.5 | 62.9 | 64.1 | 86.4 | W | 69.6 | 93.3 | 71.3 | 75.5 |
| August | 85.4 | 72.6 | 74.5 | 80.4 | 70.8 | 71.4 | 91.2 | W | 76.6 | 98.1 | 78.7 | 82.2 |
| September | 87.1 | 68.6 | 70.1 | 82.1 | 67 | 66.7 | 92.9 | W | 73 | 99.4 | 74.9 | 78.9 |
| October | 83.8 | 63.2 | 66.5 | 78.9 | 61.3 | 63.1 | 89.3 | W | 69.1 | 95.1 | 69.8 | 74.7 |
| November | 80.5 | 61.6 | 64.2 | 75.4 | 59.8 | 60.9 | 86.5 | W | 66.7 | 92.3 | 67.5 | 72 |
| December | 78.1 | 59.2 | 61 | 72.8 | 57.6 | 57.6 | 84 | W | 63.9 | 89.6 | 64.5 | 69.1 |
| Average | 83.9 | 66.7 | 69.1 | 78.8 | 65.8 | 65.8 | 89.7 | W | 71.7 | 96 | 72.6 | 77.2 |
| 1996 | ||||||||||||
| January | 71.9 | 59.8 | 60.4 | 65.7 | 57.6 | 56.4 | 76.7 | 60.3 | 61.9 | 84 | 66.3 | 68.6 |
| February | 72.8 | 58 | 61.2 | 66.6 | 56 | 57.2 | 77.7 | 58.5 | 62.8 | 84.1 | 64.3 | 69.5 |
| March | 76.2 | 64.5 | 67.3 | 70.1 | 62.6 | 63.6 | 81.3 | 64.6 | 68.7 | 88.4 | 70.1 | 75.5 |
| April | 87.8 | 73.9 | 76.6 | 82.2 | 71.8 | 73.1 | 93.3 | 74.5 | 78.3 | 99.8 | 80.5 | 85.1 |
| May | 93.8 | 75.6 | 77.9 | 88.8 | 73.3 | 74.3 | 100.2 | 77.2 | 80.8 | 105.7 | 82.1 | 87.2 |
| June | 92.8 | 66.2 | 71.3 | 87.8 | 64.2 | 67.2 | 99.1 | 67.5 | 75.1 | 102.7 | W | 81.3 |
| July | 90.3 | 65.7 | 71.5 | 85.1 | 64 | 67.6 | 97 | 66.6 | 74.8 | 100.4 | 72.3 | 80.7 |
| August | 86.2 | 65.9 | 70.4 | 81.1 | 64.1 | 66.6 | 92.1 | W | 73.4 | 95.8 | 72.9 | 79.7 |
| September | 85.2 | 66.7 | 71 | 79.7 | 64.7 | 67.4 | 90.9 | W | 73.6 | 98.2 | 73.8 | 80 |
| October | 85.1 | 69 | 73.9 | 79.8 | 67.5 | 70.5 | 90.4 | W | 76.4 | 97.7 | 75.5 | 82.6 |
| November | 88.2 | 74.1 | 76.2 | 83 | 72.3 | 72.9 | 93.7 | W | 78.3 | 101 | 79.5 | 84.6 |
| December | 89.8 | 72.3 | 75.3 | 84.6 | 70.7 | 72 | 95.3 | W | 77.9 | 102.8 | 78.8 | 83.2 |
| Average | 85.3 | 68 | 71.4 | 80.1 | 66.3 | 67.8 | 90.7 | 68.6 | 73.7 | 96.5 | 74.4 | 79.8 |
| 1995 | ||||||||||||
| January | 81 | 61 | 62.5 | 74 | 58.5 | 58 | 86.6 | 62 | 65.5 | - | 68.8 | 70.9 |
| February | 77.5 | 60.9 | 62.6 | 70.7 | 58.5 | 58.2 | 83 | 61.8 | 65 | 90.4 | 67 | 71.1 |
| March | 76.1 | 59.3 | 61.3 | 69.1 | 56.5 | 57 | 82 | 60.7 | 63.6 | 89.5 | 66.5 | 69.9 |
| April | 77.3 | 64.7 | 67.5 | 70.4 | 62.1 | 63.5 | 83.2 | 66.2 | 69 | 90.8 | 71.8 | 75.7 |
| May | 83.1 | 70.9 | 73.5 | 76.6 | 68.4 | 69.6 | 89.2 | 72 | 75.3 | 96.8 | 78.3 | 81.7 |
| June | 85.5 | 68.4 | 69.9 | 79.4 | 65.8 | 65.7 | 91.1 | 69.8 | 72.2 | 98.2 | 75.7 | 78.6 |
| July | 81.5 | 60.5 | 63 | 75.2 | 57.9 | 58.6 | 87.5 | 62.1 | 65.5 | 93.3 | 68.1 | 72.3 |
| August | 77.4 | 59.1 | 62.1 | 71.2 | 56.6 | 58.1 | 82.9 | 60.1 | 64.1 | 89.4 | 66.4 | 70.6 |
| September | 74.9 | 60.4 | 61.6 | 68.7 | 58.1 | 57.7 | 80.1 | 61.2 | 63.2 | 87.7 | 66.7 | 69.9 |
| October | 73.6 | 55.8 | 57.5 | 67.3 | 53.5 | 53.3 | 78.8 | 57 | 59.6 | 85.8 | 62.5 | 66 |
| November | 70.6 | 54 | 56.5 | 64.2 | 51.9 | 52.6 | 75.4 | 54.6 | 58 | 82.7 | 60.1 | 64.6 |
| December | 70.1 | 57 | 58.8 | 63.6 | 54.7 | 54.8 | 75 | 57.7 | 60.2 | 82 | 63.3 | 66.9 |
| Average | 77.4 | 61 | 63.1 | 71 | 58.6 | 59 | 83 | 62 | 65.2 | 89.8 | 68 | 71.5 |
Notes:
| Underground | Aboveground | |
| VIRGINIA TOTAL | 598,964,926 | 1,675,238,220 |
| AV GAS | 609,678 | 3,476,720 |
| BUNKER C | 45,000 | 161,375,145 |
| DIESEL | 163,724,218 | 312,588,781 |
| EMERGENCY GENERATOR | 2,174,117 | 32,650 |
| FUEL OIL | 517,225 | 218,205,505 |
| GASOHOL | 187,350 | 20,000 |
| GASOLINE | 242,151,414 | 335,693,465 |
| HAZARD | 5,744,648 | 38,139 |
| HEATING OIL | 82,480,438 | 42,378,538 |
| HYDRAULIC OIL | 166,120 | 167,978 |
| JET FUEL | 61,160,500 | 121,509,968 |
| KEROSENE | 17,870,471 | 26,101,142 |
| LUBE OIL | 5,992,541 | 10,733,860 |
| MIXTURE | 492,680 | 1,506,000 |
| MOTOR OIL | 1,015,840 | 61,510 |
| UNREPORTED | 219,335 | 13,203,617 |
| OTHER | 1,401,726 | 362,408,390 |
| UNKNOWN | 7,570,070 | 59,074,500 |
| USED OIL | 5,441,555 | 6,662,312 |
Notes:
- "UNREPORTED" = information was not available in the data source, also listed as "NULL".
- The above data are updated periodically by Virginia DEQ. For the latest update please visit: http://www.deq.state.va.us/tanks/
- Data from tanks that are permanently out of use, have been removed from the ground, or have been dismantled were not included in these totals.
Source:
- Registered petroleum storage tanks database, Virginia DEQ. Downloaded 06/01/07.
-
| FACILITY TYPE | Underground | Aboveground | |
| VIRGINIA TOTAL | 403,484,744 | 1,514,522,484 | |
| AV GAS | AIRCRAFT | 8,000 | 131,000 |
| AV GAS | AIRLINE | 12,000 | 82,000 |
| AV GAS | BULK STORAGE | - | 1,424,010 |
| AV GAS | COMMERCIAL | 20,000 | 43,000 |
| AV GAS | FEDERAL: MILITARY | 25,000 | 28,000 |
| AV GAS | FEDERAL: NON-MILITARY | - | 20,000 |
| AV GAS | GAS STATION | 20,000 | 12,000 |
| AV GAS | INDUSTRIAL | 20,000 | 11,000 |
| AV GAS | LOCAL | 98,000 | 186,750 |
| AV GAS | PETROLEUM DISTRIBUTOR | - | 1,514,000 |
| AV GAS | STATE | - | 12,000 |
| AV GAS TOTAL | 203,000 | 3,451,760 | |
| BUNKER C | BULK STORAGE | - | 4,125,412 |
| BUNKER C | COMMERCIAL | - | 5,784,400 |
| BUNKER C | FEDERAL: NON-MILITARY | - | 240,000 |
| BUNKER C | INDUSTRIAL | 40,000 | 12,570,410 |
| BUNKER C | PETROLEUM DISTRIBUTOR | - | 48,220,841 |
| BUNKER C | STATE | - | 487,200 |
| BUNKER C | UNKNOWN | - | 40,000 |
| BUNKER C | UTILITY | - | 72,114,000 |
| BUNKER C TOTAL | 40,000 | 143,582,263 | |
| DIESEL | AIRCRAFT | 20,000 | |
| DIESEL | AIRLINE | 36,275 | 25,233 |
| DIESEL | AUTO DEALER | 65,100 | 14,000 |
| DIESEL | BULK STORAGE | 24,000 | 17,717,258 |
| DIESEL | COMMERCIAL | 5,816,391 | 14,111,017 |
| DIESEL | CONTRACTOR | 864,550 | 998,797 |
| DIESEL | FARM | 162,550 | 108,500 |
| DIESEL | FEDERAL: MILITARY | 37,836,865 | 58,097,470 |
| DIESEL | FEDERAL: NON-MILITARY | 37,836,865 | 126,400 |
| DIESEL | GAS STATION | 16,422,422 | 1,858,575 |
| DIESEL | INDUSTRIAL | 1,622,637 | 13,792,180 |
| DIESEL | LOCAL | 3,429,596 | 1,020,545 |
| DIESEL | OTHER | 219,880 | 65,750 |
| DIESEL | PETROLEUM DISTRIBUTOR | 1,635,480 | 149,490,644 |
| DIESEL | RAILROAD | 65,565 | 1,189,275 |
| DIESEL | RESIDENTIAL | 22,050 | 7,000 |
| DIESEL | STATE | 51,226,485 | 515,400 |
| DIESEL | TRUCKING/TRANSPORT | 2,774,480 | 959,050 |
| DIESEL | UNKNOWN | 642,220 | 139,640 |
| DIESEL | UNREPORTED | 164,500 | 75,000 |
| DIESEL | UTILITY | 963,799 | 25,062,522 |
| DIESEL TOTAL | 124,675,981 | 285,394,256 | |
| EMERGENCY GENERATOR | COMMERCIAL | 406,605 | 8,000 |
| EMERGENCY GENERATOR | FEDERAL: MILITARY | 111,050 | 6,000 |
| EMERGENCY GENERATOR | FEDERAL: NON-MILITARY | 51,600 | - |
| EMERGENCY GENERATOR | GAS STATION | 5,000 | - |
| EMERGENCY GENERATOR | INDUSTRIAL | 325,000 | - |
| EMERGENCY GENERATOR | LOCAL | 251,505 | 1,350 |
| EMERGENCY GENERATOR | OTHER | 9,550 | - |
| EMERGENCY GENERATOR | RESIDENTIAL | 4,250 | - |
| EMERGENCY GENERATOR | STATE | 144,025 | 13,000 |
| EMERGENCY GENERATOR | UNKNOWN | 2,500 | - |
| EMERGENCY GENERATOR | UNREPORTED | 550 | - |
| EMERGENCY GENERATOR | UTILITY | 217,300 | - |
| EMERGENCY GENERATOR TOTAL | 1,528,935 | 32,650 | |
| FUEL OIL | AIRLINE | - | 82,500 |
| FUEL OIL | AUTO DEALER | - | 2,000 |
| FUEL OIL | BULK STORAGE | - | 1,241,530 |
| FUEL OIL | COMMERCIAL | 29,000 | 22,835,778 |
| FUEL OIL | CONTRACTOR | - | 438,087 |
| FUEL OIL | FARM | - | 3,000 |
| FUEL OIL | FEDERAL: MILITARY | - | 6,299,460 |
| FUEL OIL | FEDERAL: NON-MILITARY | - | 285,407 |
| FUEL OIL | GAS STATION | 32,500 | 10,280,961 |
| FUEL OIL | INDUSTRIAL | 28,000 | 34,723,699 |
| FUEL OIL | LOCAL | - | 166,287 |
| FUEL OIL | OTHER | - | 21,600 |
| FUEL OIL | PETROLEUM DISTRIBUTOR | 80,000 | 55,010,003 |
| FUEL OIL | RAILROAD | - | 430,250 |
| FUEL OIL | RESIDENTIAL | - | 28,500 |
| FUEL OIL | STATE | 24,000 | 406,415 |
| FUEL OIL | TRUCKING/TRANSPORT | - | 18,000 |
| FUEL OIL | UNKNOWN | 8,000 | 51,500 |
| FUEL OIL | UTILITY | - | 55,759,003 |
| FUEL OIL TOTAL | 201,500 | 188,083,980 | |
| GASOHOL | AUTO DEALER | - | 20,000 |
| GASOHOL | COMMERCIAL | 38,000 | - |
| GASOHOL | GAS STATION | 28,550 | - |
| GASOHOL TOTAL | 66,550 | 20,000 | |
| GASOLINE | AIRCRAFT | 2,000 | 1,000 |
| GASOLINE | AIRLINE | 163,000 | 92,000 |
| GASOLINE | AUTO DEALER | 641,100 | 52,500 |
| GASOLINE | BULK STORAGE | 24,000 | 158,550 |
| GASOLINE | COMMERCIAL | 7,990,091 | 17,130,518 |
| GASOLINE | CONTRACTOR | 517,555 | 138,900 |
| GASOLINE | FARM | 89,280 | 12,550 |
| GASOLINE | FEDERAL: MILITARY | 9,082,470 | 211,423 |
| GASOLINE | FEDERAL: NON-MILITARY | 470,490 | 31,000 |
| GASOLINE | GAS STATION | 104,775,098 | 828,160 |
| GASOLINE | INDUSTRIAL | 586,275 | 7,491,475 |
| GASOLINE | LOCAL | 2,915,455 | 332,250 |
| GASOLINE | OTHER | 230,800 | 37,000 |
| GASOLINE | PETROLEUM DISTRIBUTOR | 2,513,480 | 292,934,058 |
| GASOLINE | RAILROAD | 13,755 | 3,775 |
| GASOLINE | RESIDENTIAL | 21,940 | 1,000 |
| GASOLINE | STATE | 2,380,850 | 211,160 |
| GASOLINE | TRUCKING/TRANSPORT | 649,300 | 9,550 |
| GASOLINE | UNKNOWN | 2,858,425 | 13,200 |
| GASOLINE | UNREPORTED | 517,500 | 24,000 |
| GASOLINE | UTILITY | 622,680 | 57,750 |
| GASOLINE TOTAL | 137,065,544 | 319,771,819 | |
| HAZARD | AUTO DEALER | 3,760 | 275 |
| HAZARD | COMMERCIAL | 463,351 | 5,000 |
| HAZARD | FEDERAL: MILITARY | 225,819 | - |
| HAZARD | GAS STATION | 2,830 | - |
| HAZARD | INDUSTRIAL | 1,034,830 | - |
| HAZARD | LOCAL | 75,650 | - |
| HAZARD | OTHER | 6,000 | - |
| HAZARD | PETROLEUM DISTRIBUTOR | 77,650 | - |
| HAZARD | TRUCKING/TRANSPORT | 12,000 | - |
| HAZARD | UNKNOWN | 10,000 | - |
| HAZARD TOTAL | 1,941,890 | 5,275 | |
| HEATING OIL | AIRLINE | 91,000 | - |
| HEATING OIL | AUTO DEALER | 61,050 | 35,000 |
| HEATING OIL | BULK STORAGE | - | 402,054 |
| HEATING OIL | COMMERCIAL | 3,297,011 | 944,375 |
| HEATING OIL | CONTRACTOR | 26,000 | 33,280 |
| HEATING OIL | FARM | 500 | 1,754,818 |
| HEATING OIL | FEDERAL: MILITARY | 44,432,250 | 1,973,700 |
| HEATING OIL | FEDERAL: NON-MILITARY | 733,534 | 744,211 |
| HEATING OIL | GAS STATION | 148,650 | 70,500 |
| HEATING OIL | INDUSTRIAL | 2,493,462 | 694,996 |
| HEATING OIL | LOCAL | 3,059,150 | 194,214 |
| HEATING OIL | OTHER | 228,000 | 46,000 |
| HEATING OIL | PETROLEUM DISTRIBUTOR | 1,122,000 | 21,963,055 |
| HEATING OIL | RAILROAD | 26,000 | 29,500 |
| HEATING OIL | RESIDENTIAL | 184,345 | 14,000 |
| HEATING OIL | STATE | 937,000 | 333,400 |
| HEATING OIL | TRUCKING/TRANSPORT | 28,050 | 12,550 |
| HEATING OIL | UNKNOWN | 388,700 | 1,550 |
| HEATING OIL | UNREPORTED | - | 3,000 |
| HEATING OIL | UTILITY | 572,000 | 15,000 |
| HEATING OIL TOTAL | 57,828,702 | 29,265,203 | |
| HYDRAULIC OIL | COMMERCIAL | - | 3,500 |
| HYDRAULIC OIL | CONTRACTOR | - | 500 |
| HYDRAULIC OIL | FEDERAL: MILITARY | 1,880 | - |
| HYDRAULIC OIL | INDUSTRIAL | 28,500 | 82,180 |
| HYDRAULIC OIL | LOCAL | 28,100 | - |
| HYDRAULIC OIL | PETROLEUM DISTRIBUTOR | 4,000 | 27,388 |
| HYDRAULIC OIL | RAILROAD | - | 1,000 |
| HYDRAULIC OIL TOTAL | 62,480 | 114,568 | |
| JET FUEL | AIRCRAFT | 21,470 | 245,000 |
| JET FUEL | AIRLINE | 53,000 | 3,516,000 |
| JET FUEL | COMMERCIAL | 42,000 | 7,779,974 |
| JET FUEL | FARM | 40,000 | - |
| JET FUEL | FEDERAL: MILITARY | 55,776,000 | 32,446,821 |
| JET FUEL | FEDERAL: NON-MILITARY | 110,000 | 18,707,219 |
| JET FUEL | INDUSTRIAL | - | 2,000 |
| JET FUEL | LOCAL | 130,000 | 1,067,200 |
| JET FUEL | PETROLEUM DISTRIBUTOR | - | 41,405,364 |
| JET FUEL | STATE | - | 12,000 |
| JET FUEL TOTAL | 56,172,470 | 105,181,578 | |
| KEROSENE | AIRCRAFT | 550 | - |
| KEROSENE | AIRLINE | 35,500 | - |
| KEROSENE | AUTO DEALER | 20,800 | 10,000 |
| KEROSENE | BULK STORAGE | 4,000 | 298,957 |
| KEROSENE | COMMERCIAL | 462,980 | 142,950 |
| KEROSENE | CONTRACTOR | 1,615 | 22,700 |
| KEROSENE | FARM | - | 275 |
| KEROSENE | FEDERAL: MILITARY | 2,235,938 | 5,000 |
| KEROSENE | FEDERAL: NON-MILITARY | 1,299,850 | 23,000 |
| KEROSENE | GAS STATION | 4,649,082 | 565,333 |
| KEROSENE | INDUSTRIAL | 37,800 | 882,060 |
| KEROSENE | LOCAL | 130,750 | 985 |
| KEROSENE | OTHER | 2,000 | 1,275 |
| KEROSENE | PETROLEUM DISTRIBUTOR | 919,150 | 21,464,348 |
| KEROSENE | RAILROAD | 1,000 | 500 |
| KEROSENE | STATE | 12,500 | 20,375 |
| KEROSENE | TRUCKING/TRANSPORT | 17,550 | 2,275 |
| KEROSENE | UNKNOWN | 127,400 | - |
| KEROSENE | UNREPORTED | 17,500 | - |
| KEROSENE | UTILITY | 451,600 | 235,145 |
| KEROSENE TOTAL | 10,427,565 | 23,675,178 | |
| LUBE OIL | AUTO DEALER | - | 20,860 |
| LUBE OIL | BULK STORAGE | - | 251,500 |
| LUBE OIL | COMMERCIAL | 7,000 | 215,618 |
| LUBE OIL | CONTRACTOR | - | 22,000 |
| LUBE OIL | FARM | - | 1,550 |
| LUBE OIL | FEDERAL: MILITARY | 5,855,000 | 343,726 |
| LUBE OIL | GAS STATION | 3,000 | - |
| LUBE OIL | INDUSTRIAL | - | 834,762 |
| LUBE OIL | LOCAL | 50,000 | 13,650 |
| LUBE OIL | PETROLEUM DISTRIBUTOR | 68,950 | 2,278,853 |
| LUBE OIL | RAILROAD | - | 113,667 |
| LUBE OIL | STATE | - | 30,000 |
| LUBE OIL | TRUCKING/TRANSPORT | - | 183,835 |
| LUBE OIL | UNKNOWN | 12,000 | 22,600 |
| LUBE OIL | UTILITY | 10,000 | 499,498 |
| LUBE OIL TOTAL | 6,005,950 | 4,860,119 | |
| MIXTURE | AIRLINE | 8,000 | - |
| MIXTURE | COMMERCIAL | 13,550 | - |
| MIXTURE | CONTRACTOR | - | 44,000 |
| MIXTURE | FARM | 1,000 | - |
| MIXTURE | FEDERAL: MILITARY | 31,200 | - |
| MIXTURE | GAS STATION | 3,000 | - |
| MIXTURE | INDUSTRIAL | - | 3,000 |
| MIXTURE | LOCAL | 50,000 | - |
| MIXTURE | PETROLEUM DISTRIBUTOR | 68,950 | 1,698,686 |
| MIXTURE | UNKNOWN | 12,000 | - |
| MIXTURE | UTILITY | 10,000 | 2,500 |
| MIXTURE TOTAL | 197,700 | 1,748,186 | |
| MOTOR OIL | AUTO DEALER | 5,375 | 275 |
| MOTOR OIL | COMMERCIAL | 99,975 | 7,000 |
| MOTOR OIL | CONTRACTOR | 500 | - |
| MOTOR OIL | FEDERAL: NON-MILITARY | 7,000 | - |
| MOTOR OIL | GAS STATION | 79,550 | - |
| MOTOR OIL | INDUSTRIAL | 11,000 | 26,500 |
| MOTOR OIL | LOCAL | 94,700 | - |
| MOTOR OIL | OTHER | - | 550 |
| MOTOR OIL | PETROLEUM DISTRIBUTOR | 48,550 | 2,000 |
| MOTOR OIL | TRUCKING/TRANSPORT | 62,050 | 4,375 |
| MOTOR OIL TOTAL | 408,700 | 40,700 | |
| OTHER | AIRCRAFT | 40,000 | - |
| OTHER | AUTO DEALER | 2,775 | - |
| OTHER | BULK STORAGE | - | 7,559,561 |
| OTHER | COMMERCIAL | 67,675 | 28,930,566 |
| OTHER | CONTRACTOR | - | 2,542,492 |
| OTHER | FEDERAL: MILITARY | 108,870 | 3,914,600 |
| OTHER | FEDERAL: NON-MILITARY | - | 8,000 |
| OTHER | GAS STATION | 24,900 | 65,790 |
| OTHER | INDUSTRIAL | 251,836 | 34,932,104 |
| OTHER | LOCAL | 25,900 | 89,063 |
| OTHER | OTHER | 7,500 | 8,000 |
| OTHER | PETROLEUM DISTRIBUTOR | 20,750 | 253,456,785 |
| OTHER | RAILROAD | - | 40,873 |
| OTHER | STATE | - | 1,032,309 |
| OTHER | TRUCKING/TRANSPORT | 14,000 | 13,445 |
| OTHER | UNKNOWN | 2,000 | 52,195 |
| OTHER | UNREPORTED | - | 15,000 |
| OTHER | UTILITY | 8,500 | 714,334 |
| OTHER TOTAL | 583,706 | 339,923,305 | |
| UNKNOWN | AIRCRAFT | 1,500 | - |
| UNKNOWN | AIRLINE | - | 31,900 |
| UNKNOWN | AUTO DEALER | 56,100 | - |
| UNKNOWN | BULK STORAGE | - | 46,415,406 |
| UNKNOWN | COMMERCIAL | 1,266,893 | 132,925 |
| UNKNOWN | CONTRACTOR | 10,000 | 25,600 |
| UNKNOWN | FARM | 6,825 | - |
| UNKNOWN | FEDERAL: MILITARY | 481,055 | - |
| UNKNOWN | FEDERAL: NON-MILITARY | 57,950 | - |
| UNKNOWN | GAS STATION | 1,072,015 | 21,000 |
| UNKNOWN | INDUSTRIAL | 286,850 | 248,200 |
| UNKNOWN | LOCAL | 322,900 | 8,000 |
| UNKNOWN | OTHER | 2,000 | - |
| UNKNOWN | PETROLEUM DISTRIBUTOR | 65,025 | 11,542,352 |
| UNKNOWN | RAILROAD | 500 | 914 |
| UNKNOWN | RESIDENTIAL | 62,200 | - |
| UNKNOWN | STATE | 12,900 | 25,000 |
| UNKNOWN | TRUCKING/TRANSPORT | 104,100 | 2,000 |
| UNKNOWN | UNKNOWN | 297,940 | 29,050 |
| UNKNOWN | UNREPORTED | - | 16,000 |
| UNKNOWN | UTILITY | 93,750 | 6,000 |
| UNKNOWN TOTAL | 4,200,503 | 58,504,347 | |
| UNREPORTED | COMMERCIAL | 38,080 | 28,100 |
| UNREPORTED | CONTRACTOR | - | 47,900 |
| UNREPORTED | FEDERAL: MILITARY | 5,000 | 12,000 |
| UNREPORTED | FEDERAL: NON-MILITARY | - | 6,000 |
| UNREPORTED | GAS STATION | 115,200 | 10,000 |
| UNREPORTED | INDUSTRIAL | - | 105,227 |
| UNREPORTED | LOCAL | 31,600 | 45,500 |
| UNREPORTED | PETROLEUM DISTRIBUTOR | - | 4,299,892 |
| UNREPORTED | RAILROAD | - | 4,500 |
| UNREPORTED | STATE | 250 | 19,000 |
| UNREPORTED | UNKNOWN | - | 630,000 |
| UNREPORTED | UNREPORTED | 2,500 | 16,000 |
| UNREPORTED | UTILITY | - | 2,390 |
| UNREPORTED TOTAL | 192,630 | 5,226,509 | |
| USED OIL | AIRCRAFT | 1,000 | - |
| USED OIL | AIRLINE | 3,000 | 1,000 |
| USED OIL | AUTO DEALER | 109,300 | 27,500 |
| USED OIL | BULK STORAGE | - | 24,000 |
| USED OIL | COMMERCIAL | 214,928 | 1,724,590 |
| USED OIL | CONTRACTOR | 18,985 | 69,081 |
| USED OIL | FARM | 2,000 | - |
| USED OIL | FEDERAL: MILITARY | 455,325 | 953,812 |
| USED OIL | FEDERAL: NON-MILITARY | 12,450 | 7,250 |
| USED OIL | GAS STATION | 365,930 | 21,952 |
| USED OIL | INDUSTRIAL | 190,620 | 1,859,768 |
| USED OIL | LOCAL | 97,470 | 31,106 |
| USED OIL | OTHER | 3,125 | 40,500 |
| USED OIL | PETROLEUM DISTRIBUTOR | 44,480 | 616,275 |
| USED OIL | RAILROAD | - | 55,000 |
| USED OIL | RESIDENTIAL | 3,000 | - |
| USED OIL | STATE | 4,550 | 6,425 |
| USED OIL | TRUCKING/TRANSPORT | 92,350 | 20,350 |
| USED OIL | UNKNOWN | 30,365 | 10,441 |
| USED OIL | UNREPORTED | - | 11,000 |
| USED OIL | UTILITY | 32,060 | 160,738 |
| USED OIL TOTAL | 1,680,938 | 5,640,788 |
Notes:
- "UNREPORTED" = information was not available in the data source.
- The above data are updated periodically by Virginia DEQ. For the latest update please visit: http://www.deq.state.va.us/tanks/
- The above data were downloaded by VCCER on June 16, 2005.
Source:
- Registered petroleum storage tanks database, Virginia DEQ. Downloaded 6/16/05.